How to describe the particle size distribution?
2023-07-12WIKI
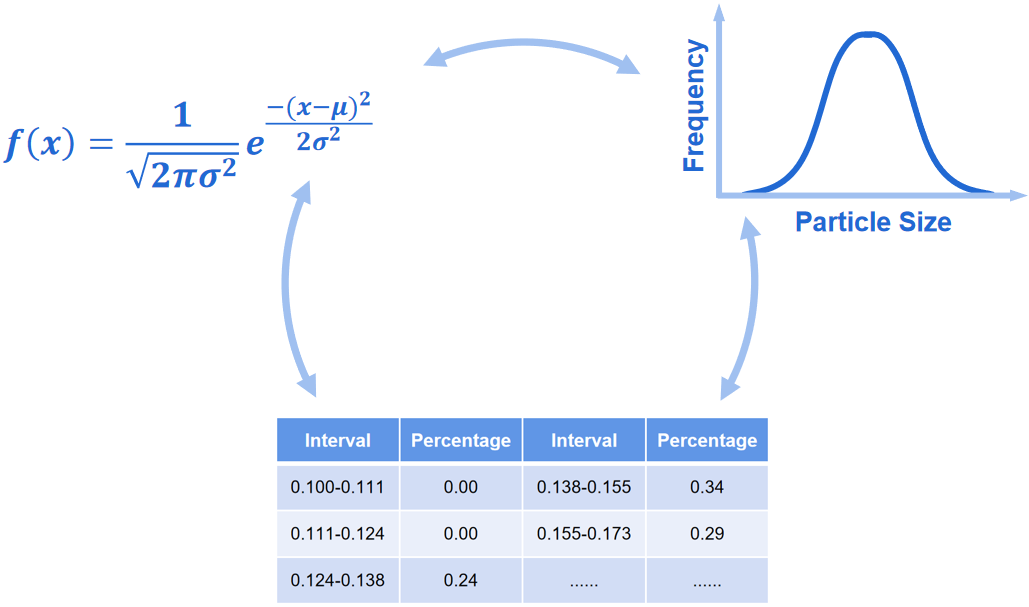
Typically, particle size distribution can be displayed using the following three methods:
Function:
Particle size distribution is presented in the form of mathematical functions, such as normal distribution function, log-normal distribution function, and R-R distribution function.
Graph:
Cumulative distribution curve, frequency distribution curve, and histogram are commonly used to describe how the particle size of the sample distributes.
Table:
Percentages and their corresponding particle size intervals are listed in the table, providing quick and intuitive access to the particle size distribution. Cumulative distribution table and frequency distribution table are included. Table is the most commonly used form to show the particle size distribution.
 |
Struggling to grasp particle analysis concepts? Our new Beginner's Guide to Particle Analysis is here to help you grasp these concepts in the most accessible manner possible. Download it as a PDF to read on the train, on the plane, or wherever else there’s no internet. |
Recommended articles
Rate this article
Share On


Related Particle Size Analyzer
BeNano 180 Zeta Pro
Nanoparticle Size and Zeta Potential Analyzer
Technology: Dynamic Light Scattering, Electrophoretic Light Scattering, Static Light Scattering
Bettersizer S3 Plus 126
Laser Diffraction Particle Size and Shape Analyzer
0.01 - 3,500μm(Laser System)
2 - 3,500μm(Image System)
Bettersizer ST
One-stop Particle Size Analyzer
Dispersion type: Wet
Size range: 0.1 - 1,000µm
Repeatability: ≤1% variation